The cardiologist’s dashboard — three roles, one screen
LISU (LimanISU-Monitor) is the client tier of the Strix platform. It’s where data from Passer and Larus, plus diagnoses and RUL from Strix, become clear screens for three audiences — with no intermediaries and no retold reports.
- For the owner — revenue, downtime and risk across every asset on one phone screen. How much the asset is earning right now, what’s holding it back.
- For the CFO — downtime in money, OEE as a financial metric, energy overruns, pilot ROI potential.
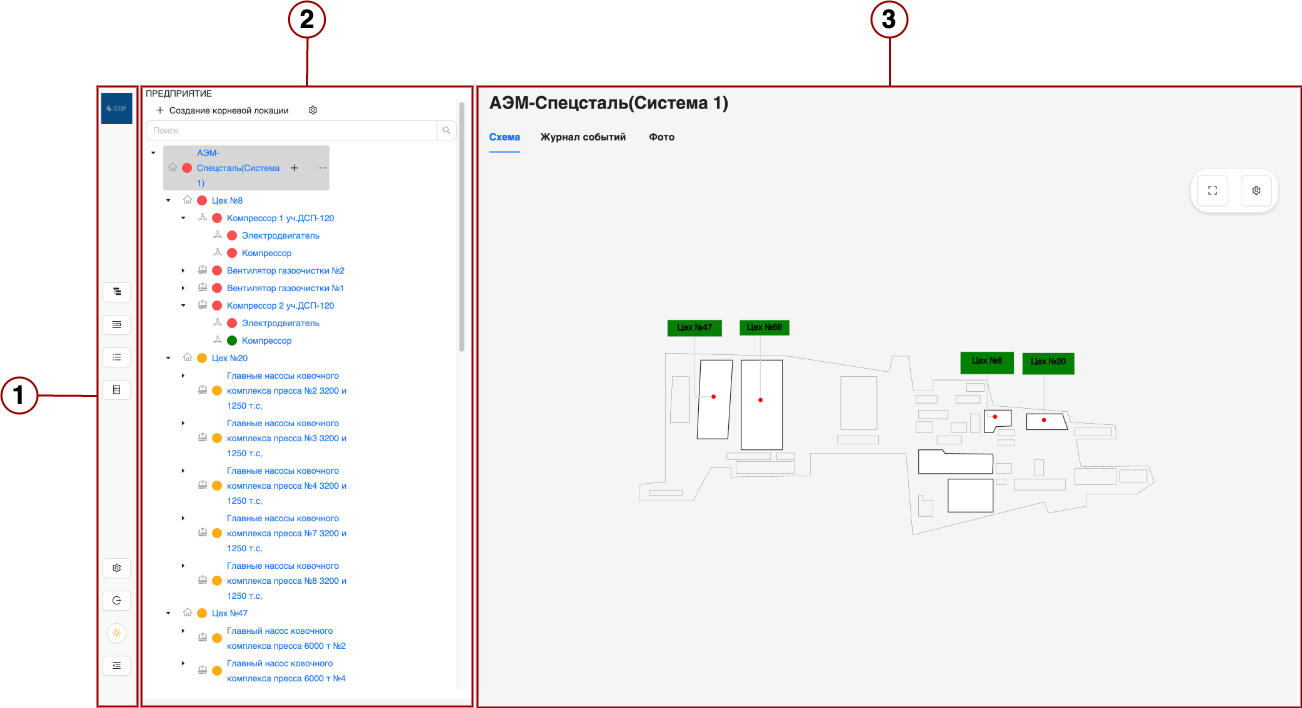
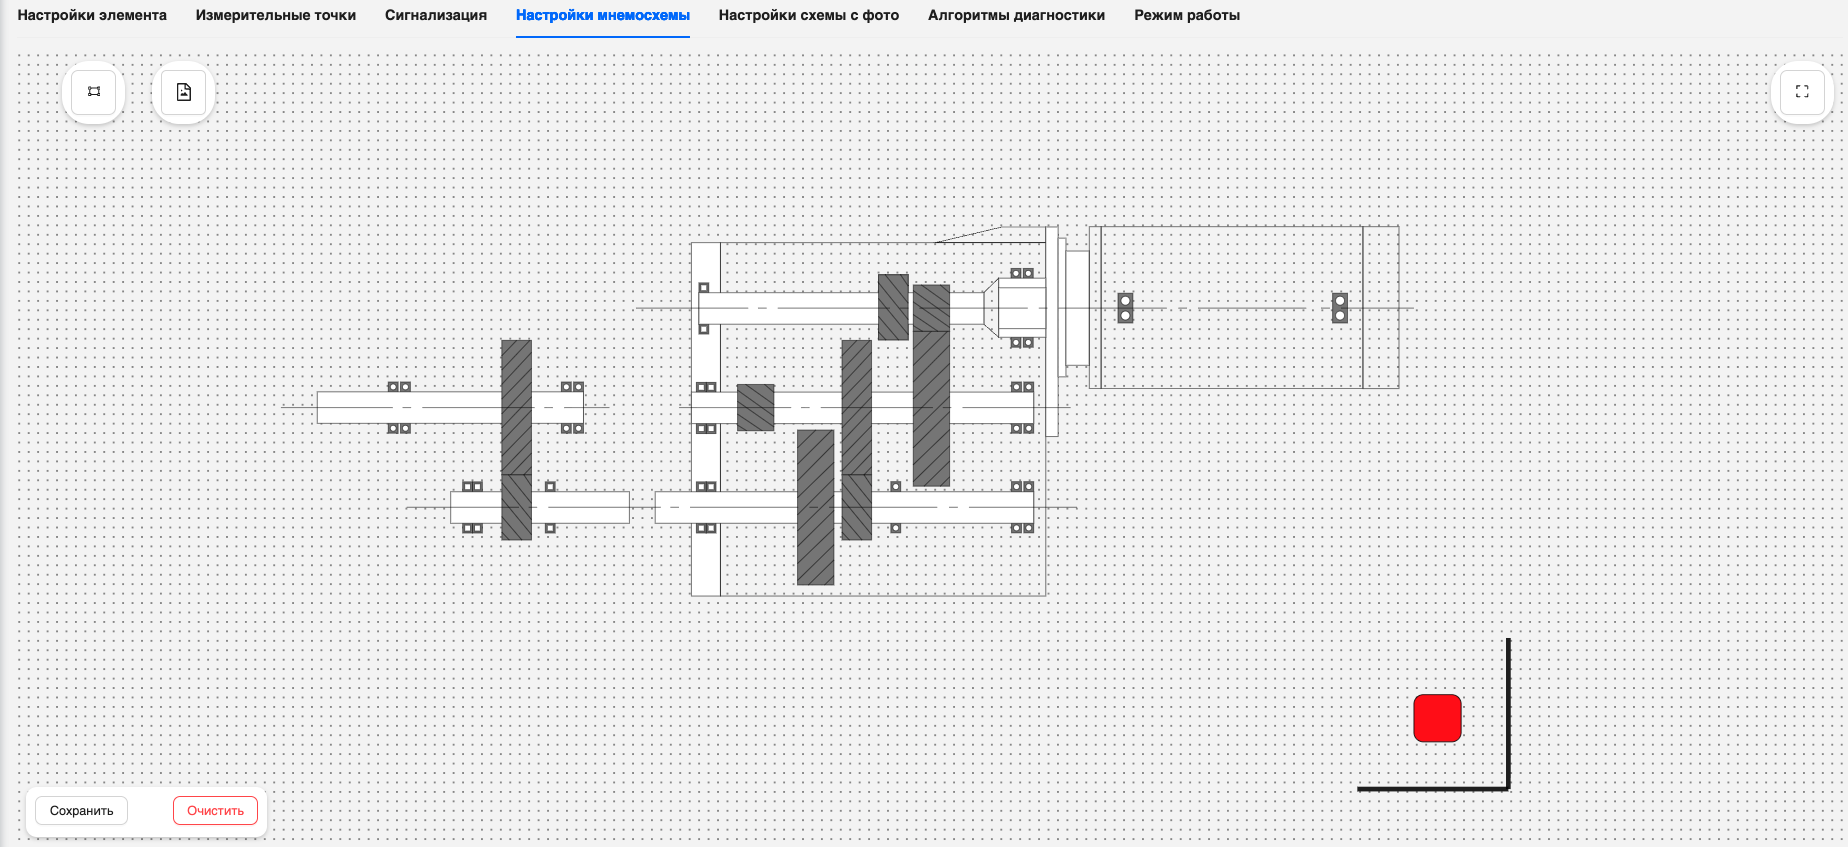
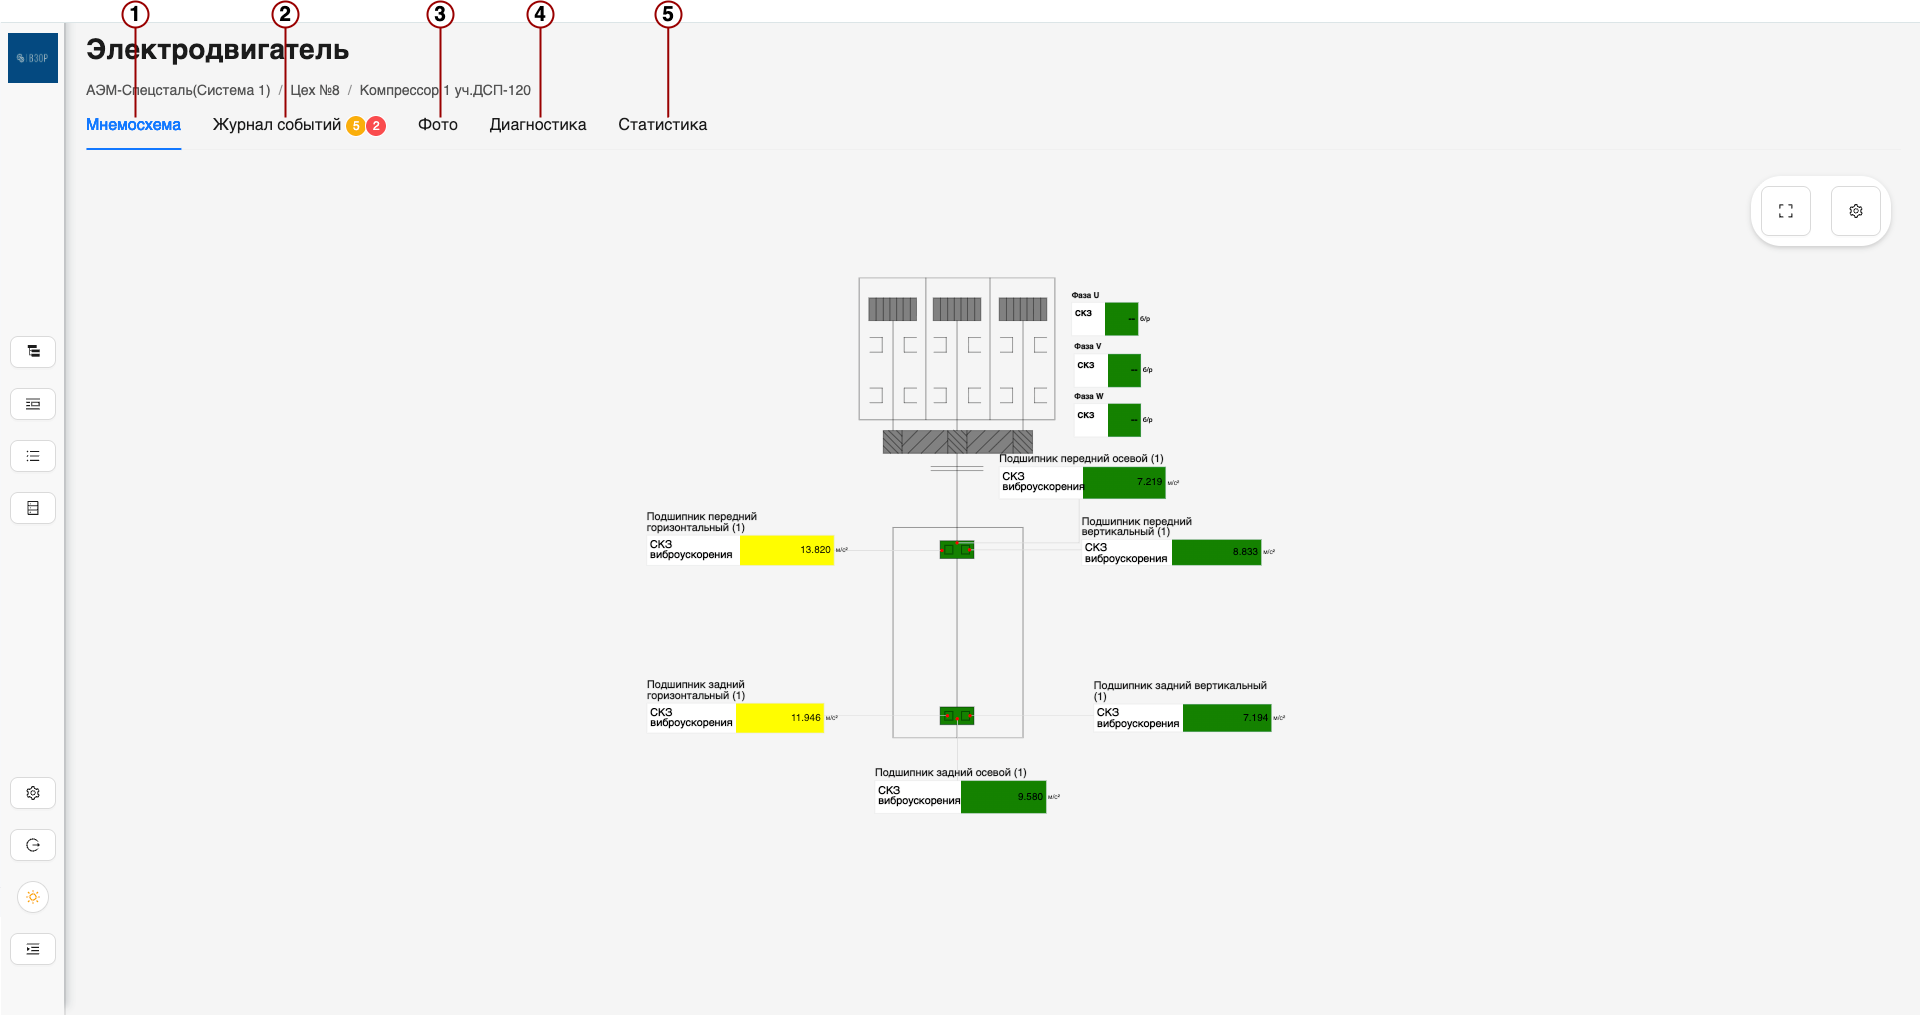
- For the chief engineer — mimic diagrams, alarms, spectra, per-node RUL, work orders.
One login — all sites
LISU runs on top of Strix and is independent of how the core is deployed — Liman-Tech cloud, your server, or a Larus-1000 appliance. One login, all sites, role-based access, audit trail.
- The web client runs in any modern browser — no install.
- iOS / Android mobile clients — primarily for the owner and CFO.
- Windows / Linux desktop — for the operator and engineer at the workstation.
Listed in the Russian software registry
LimanISU-Monitor is listed in the Russian Ministry of Digital Development unified software registry (Oct 3, 2022, registry №15057). This means:
- Procurement as Russian software under 44-FZ and 223-FZ.
- Satisfies import-substitution requirements for state and quasi-state sectors.
- No dependency on foreign license servers — works in an air-gapped network.
What’s inside
- Mimic diagrams and alarms (powered by Strix.SCADA).
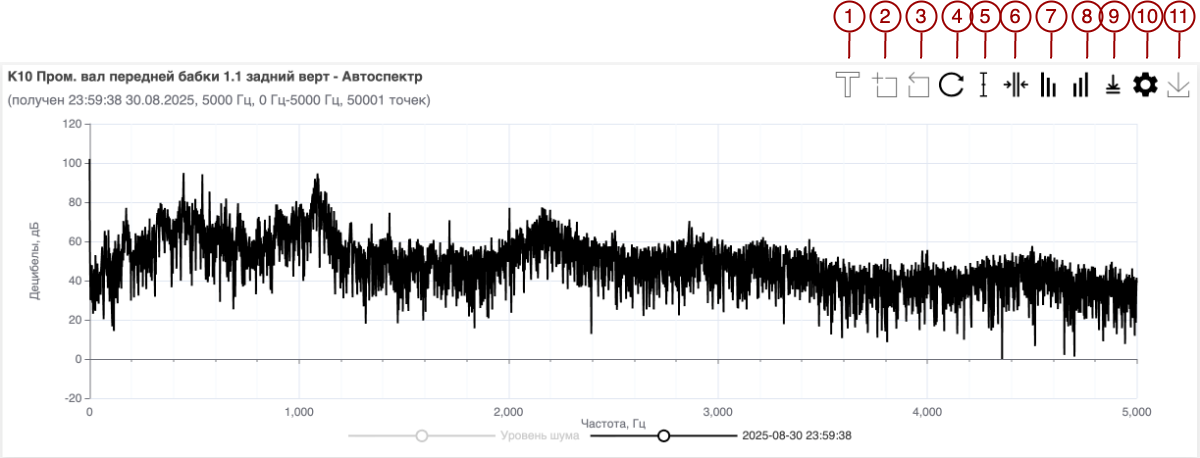
- Trends, spectra and RUL per node (powered by Strix.Diagnostics).
- Control loops and soft sensors (powered by Strix.APC) — for the operator.
- Financial metrics: OEE, availability, downtime in money, pilot ROI.
- Notifications — push to phone, e-mail, messengers.
Documentation
Full user, admin and developer documentation lives at docs.liman-tech.ru/limanisu:
- System overview — composition, architecture, key features.
- User guide — login, equipment tree, monitoring, diagnostics, RUL prediction.
- Admin guide — deployment, requirements, network, maintenance.
- Developer guide — services, protocols, databases, debugging.
How it fits
| Layer | Product |
|---|---|
| L0 — signal | Passer-V, Passer-T |
| L1 — edge | Larus-10 / Larus-100 / Larus-1000 |
| L2 — platform | Strix (data fabric + analytics) |
| L3 — HMI | LISU-Monitor |
Start here: book a demo. We’ll review your asset fleet and walk through the screens for all three roles.